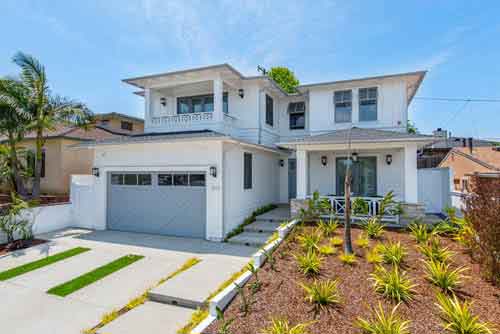
Manhattan Beach Real Estate Update
11 Sold Homes in Manhattan Beach in October 2023
It was a slow month for home sales in Manhattan Beach in October.
There were only 11 home sales during the month which isn’t unheard of by any means, but still slower than normal. Compare the 11 sales to the very busy September and August with 28 and 35 in those summer months.
The average “asking price” in October was $3,496,182 with the average sold price at $3,423,670 compared to $3,275,107 in September.
The average price per square foot was down from August and was $1430 in September. Homes averaged only 21 days on market before going into escrow.
See how this compares to other months on our Manhattan Beach real estate trends and statistics page.
Sold Homes in Manhattan Beach During October 2023
| Home Type | Address | Price | $ Per Foot | Bed/Bath | Sq Feet | Age | |
| TWNHS/A | 315 | Gull St | $3,100,000 | $1,223 | 3/3,0,1,0 | 2535/O | 2006/ASR |
| TWNHS/A | 221 | 4th PL | $3,100,000 | $1,240 | 3/2,1,1,0 | 2500/B | 2001/ASR |
| CONDO | 4406 | The Strand | $4,623,373 | $2,162 | 3/2,0,1,0 | 2138/ | 1992 |
| TWNHS/D | 412 | Manhattan Ave | $5,600,000 | $2,240 | 4/1,3,1,0 | 2500/B | 2023/BLD |
| SFR/D | 2508 | Pacific AVE | $1,810,000 | $1,407 | 3/1,1,0,0 | 1286/A | 1950/ASR |
| SFR/D | 2416 | Palm AVE | $2,355,000 | $839 | 5/2,1,0,0 | 2808/T | 1961/ASR |
| SFR/D | 2701 N | Valley DR | $2,462,000 | $1,307 | 4/2,1,0,0 | 1883/A | 1963/ASR |
| SFR/D | 118 N | Ardmore AVE | $2,550,000 | $1,510 | 2/2,0,0,0 | 1689/A | 1952/ASR |
| SFR/D | 868 | 9th ST | $8,495,000 | $1,537 | 5/2,3,1,0 | 5526/P | 2021 |
| TWNHS/A | 34 | Bermuda Ct. | $1,890,000 | $910 | 3/2,0,1,0 | 2077/A | 1987/ASR |
| SFR/D | 1612 | Magnolia AVE | $1,675,000 | $1,355 | 4/1,1,0,0 | 1236/A | 1947/ASR |

